Role
Product Designer
Company
Factorial, 2023 Q2 – 2024
Summary
The Workspace is the FP&A (Financial Planning & Analysis) product launched within Factorial’s Finance suite with the main goal of helping C-levels, controllers and managers to understand their companies costs. It was conceptualized and launched in a quarter (2023 Q2) with 115 companies using it in a monthly basis to make financial decisions at the end of the Q. Now (2024 Q2) there are 381 companies.
Context
I joined Factorial in 2022 when a new team was being created within the Finance domain. We didn’t have a mission or a concrete problem to solve, although there were many finance related pains we could work on.
Until then, users were people from HR and managers, and Factorial’s features were mostly related to HR processes. Strategically, we wanted to expand the profiles we were oriented to. I collected all the information we already had (through CX, Sales and others teams’ research) and talked with people from 20 companies’ Finance teams: CFOs, controllers, accountants… Our goal was to find problems that we could solve in a quick way by taking advantage of data that Factorial already had.
There was a big opportunity in FP&A (Financial Planning and Analysis). To understand their company costs, most of companies had developed complex Excels that they nurtured monthly with information that they downloaded from Factorial or managed in other Excels shared with managers and HR.
Scoping the problem
The team had a mission: help companies to understand their costs. But it was too big to tackle at once and we didn’t even have all the data we needed. This didn’t mean we couldn’t provide value in a single Q, we just needed to break the problem, launch and keep iterating while adding customers’ feedback and needs.
We started by analyzing which datasources were needed to provide useful financial insights and which already were available in Factorial to make easier both the implementation and the adoption.
When talking with finance people we learnt that the biggest expense in a company’s accounting usually was payroll. The exception were companies that manufacture their own products, and none of ours had this case, so we decided that our products’ first launch would contain payroll costs.
Key insights from research
There were some questions every company needed to answer around payroll costs. Not only to understand the company’s current status, but to be able to make forecasts, budgets and make decisions such as if a new employee can be hired or not. Questions like:
- How many employees does the company have?
- How much does the company spend on salaries?
- How is this amount evolving across time?
- How much a specific team, cost center or a project costs?
- How much does a specific employee or role cost?
When talking with people from finance teams we also wanted to learn how were they currently solving the problem and also to share any concerns using a new tool. We got two valuable insights:
- Estimated data is better than no data at all.
- Knowing the source of the data and the calculations (if any) is key to trust and use it.
Design
The scope to launch and test this new product was a quarter. After that, if the clients feedback was positive we could iterate, so we put the focus on answering the questions about cost and designed the first version with already implemented components. They were far from perfect, especially the data visualizations, but enough for a proof of concept.
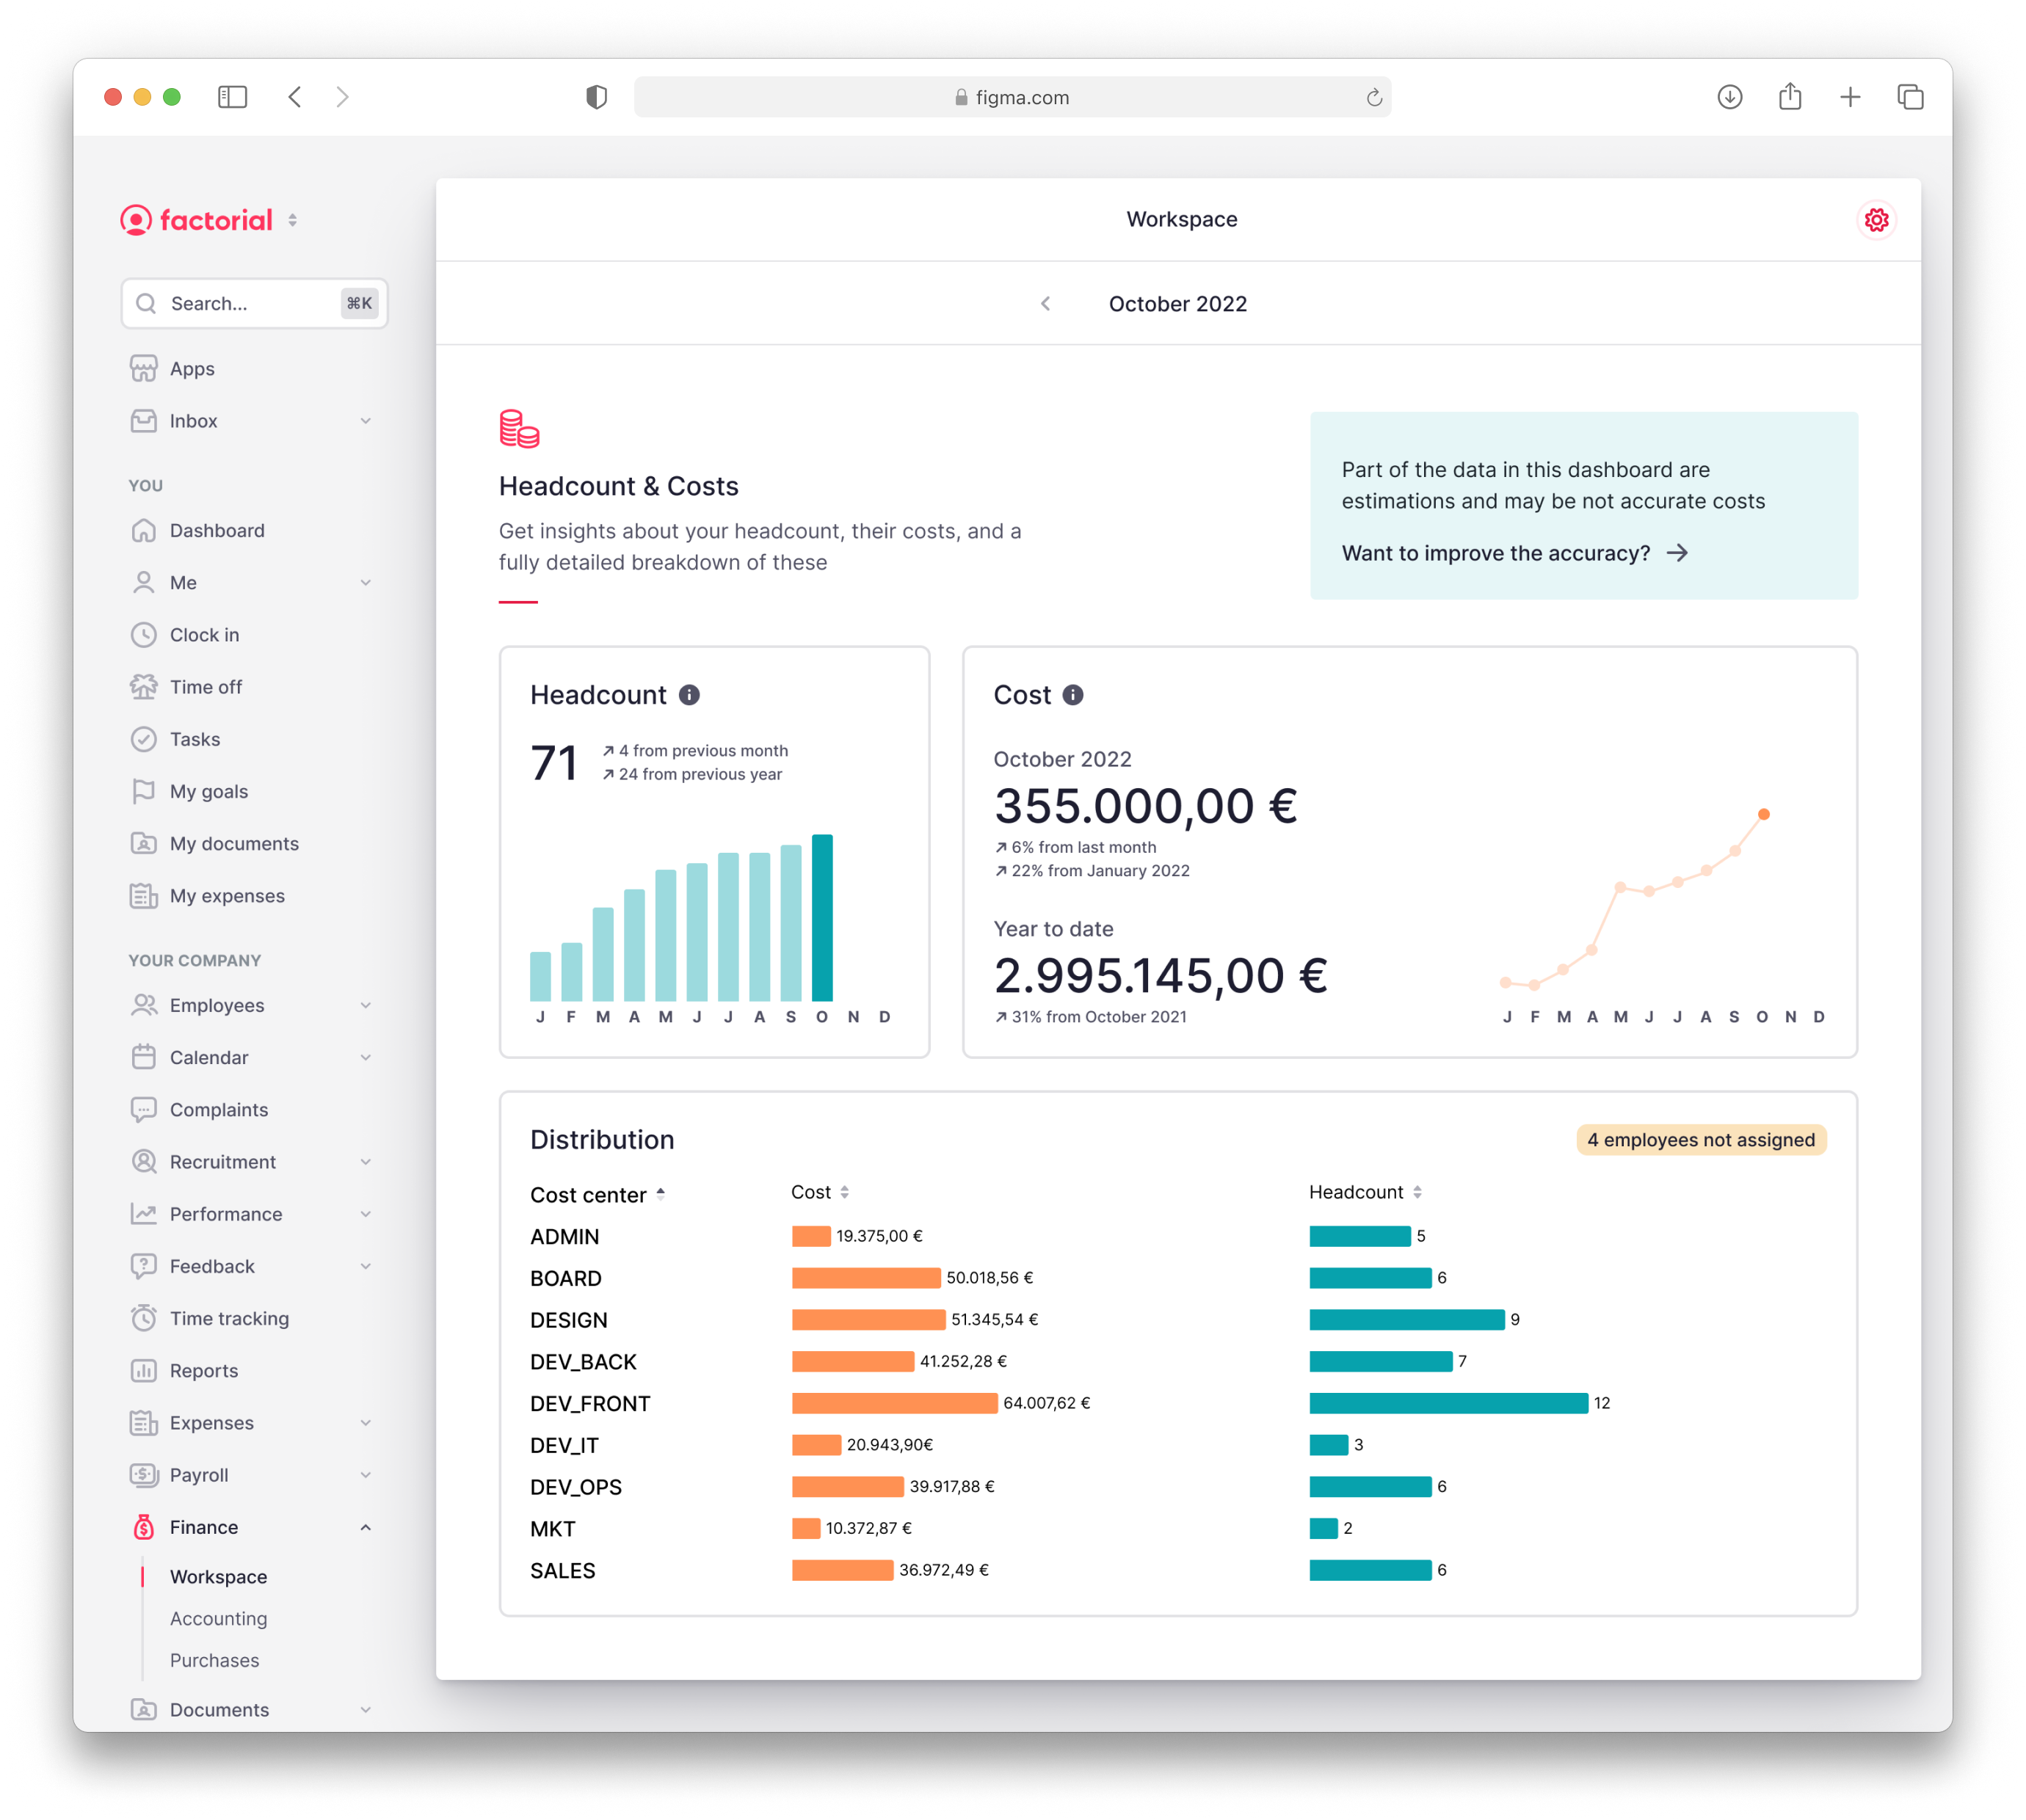
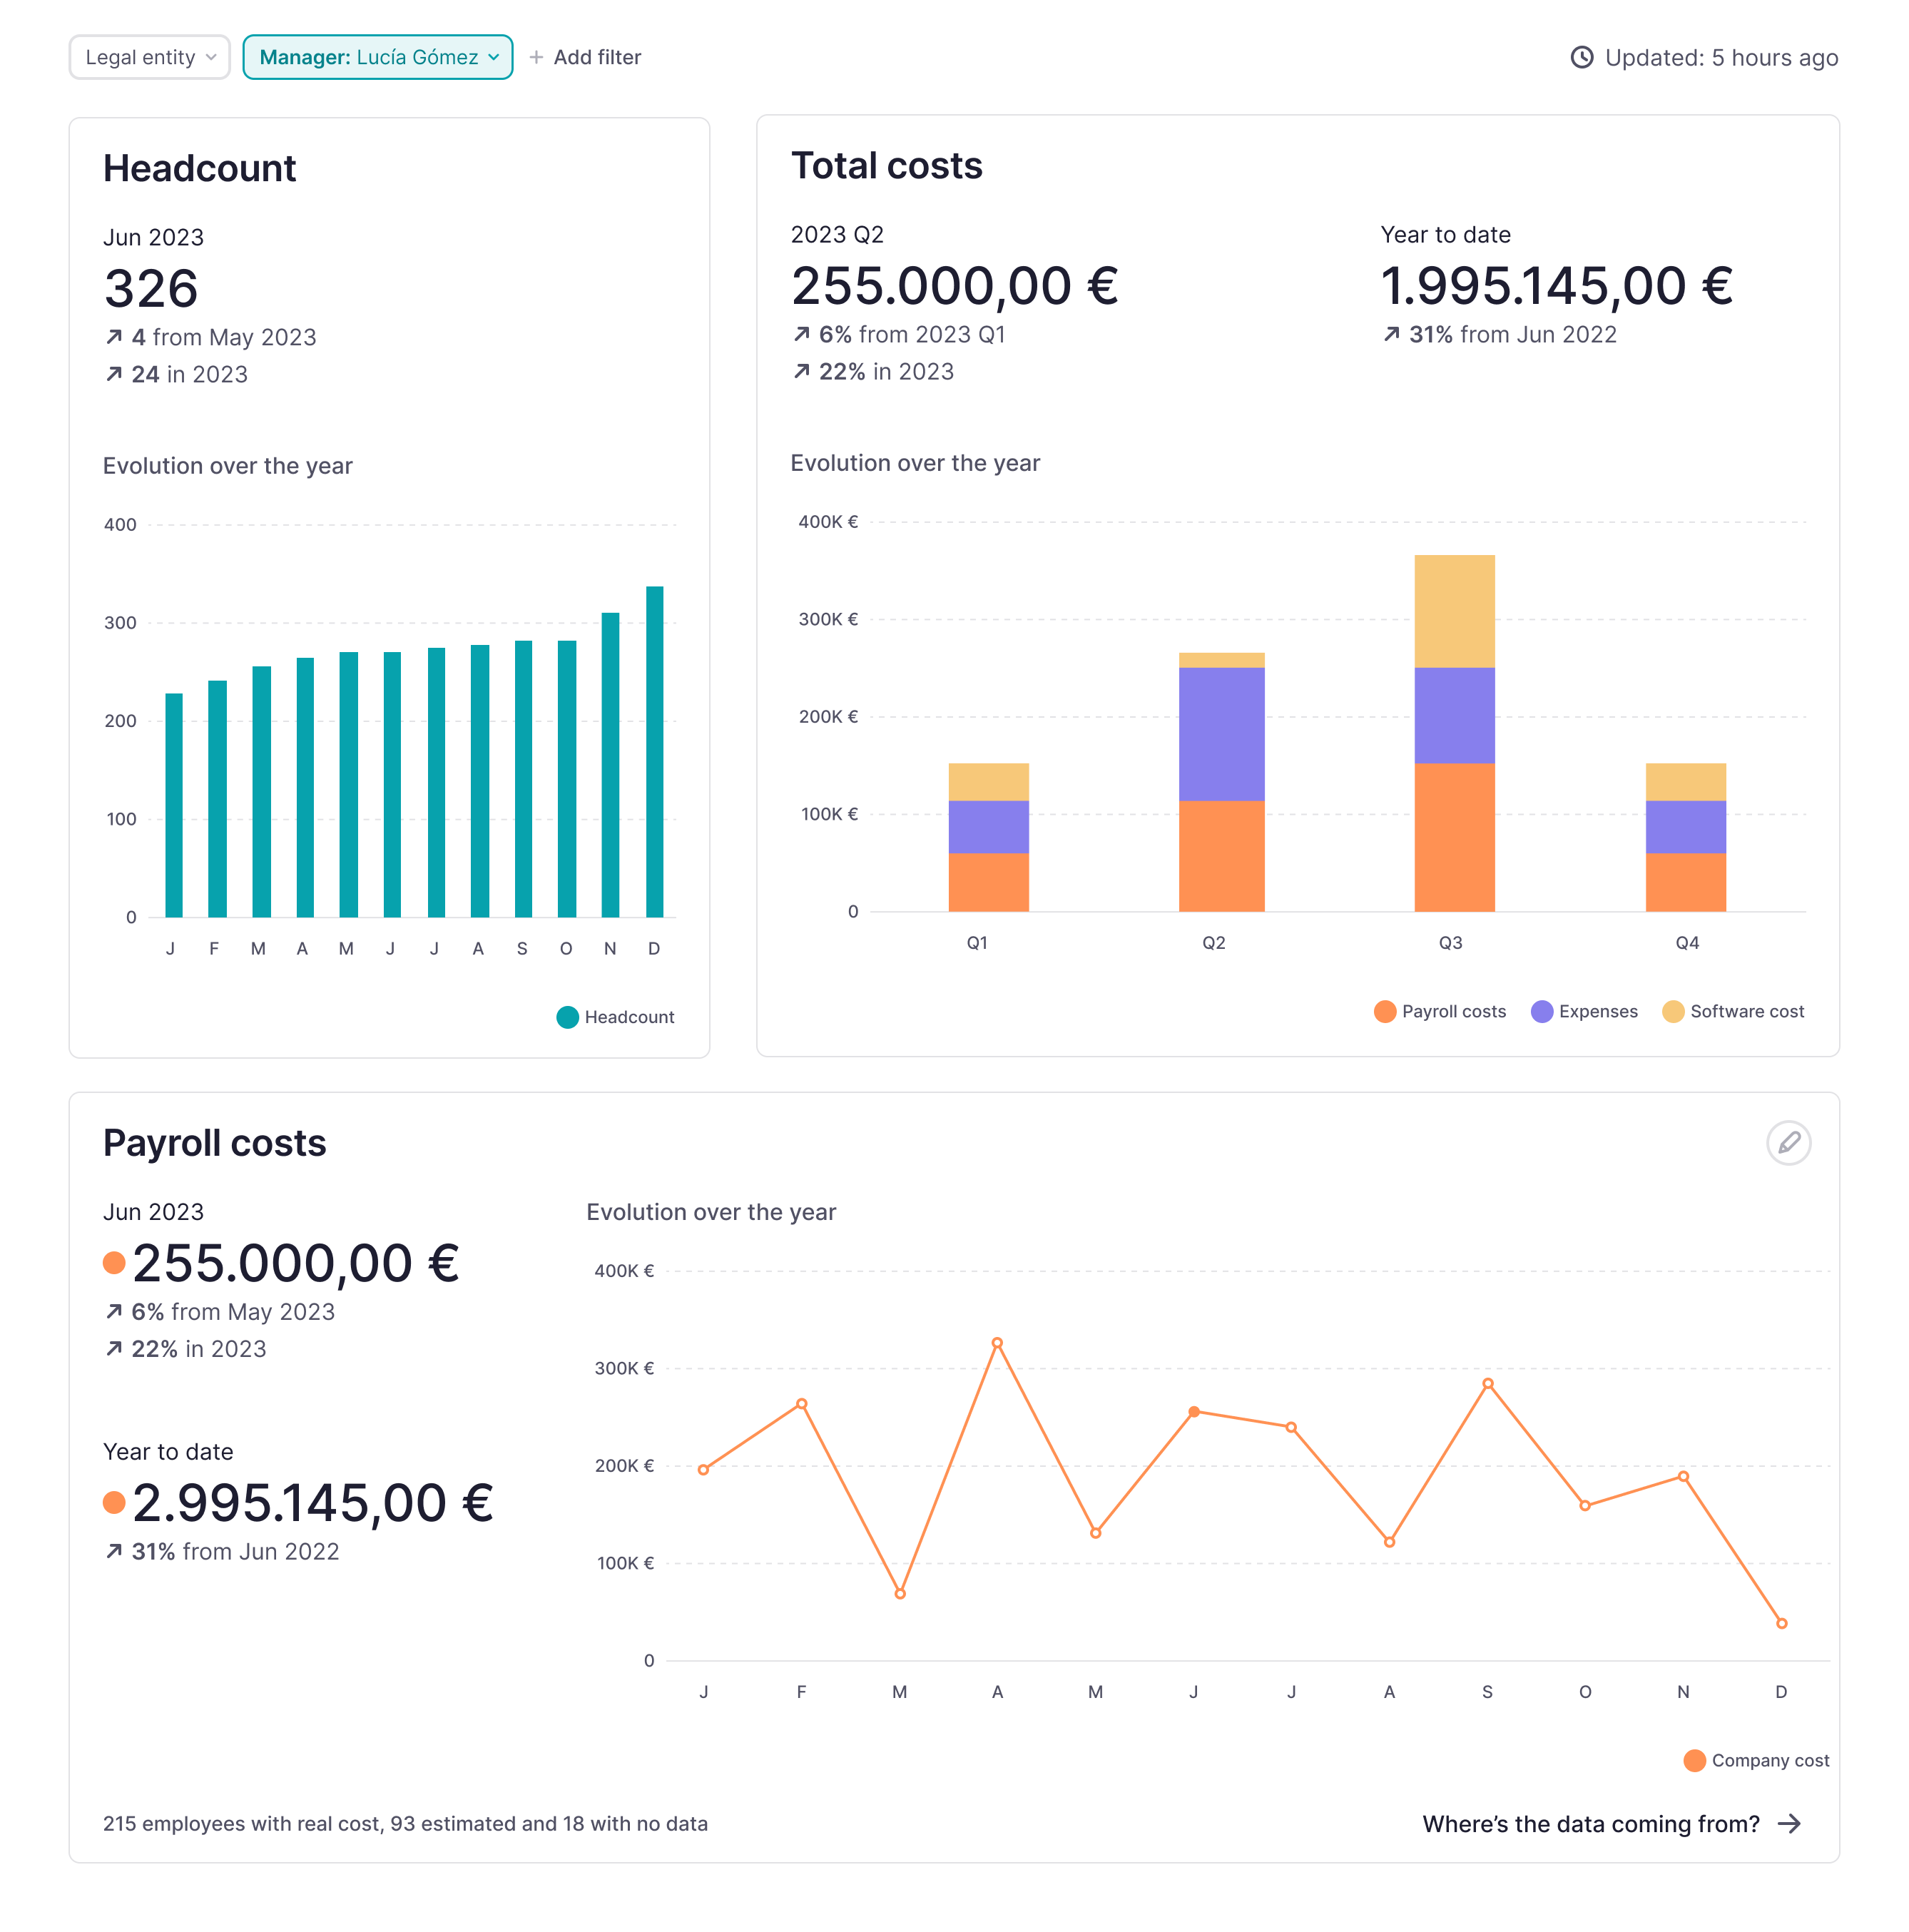
I decided to start with three cards to show «the big numbers»:
- Headcount: Shows the number of employees the company has and its evolution over the current fiscal year
- Company costs: Shows how much the company spent in the last month (payroll related), in the current fiscal year and the evolution.
- Cost distribution: Dimensions are used to break the cost in a way that makes sense for the company. In the first version we used cost centers (already available in Factorial for every company) even though we knew we’d need to add more dimensions.
From the cards, users can navigate to a second level where more detailed information is shown, so they could understand where the number is coming from (progressive disclosure pattern):
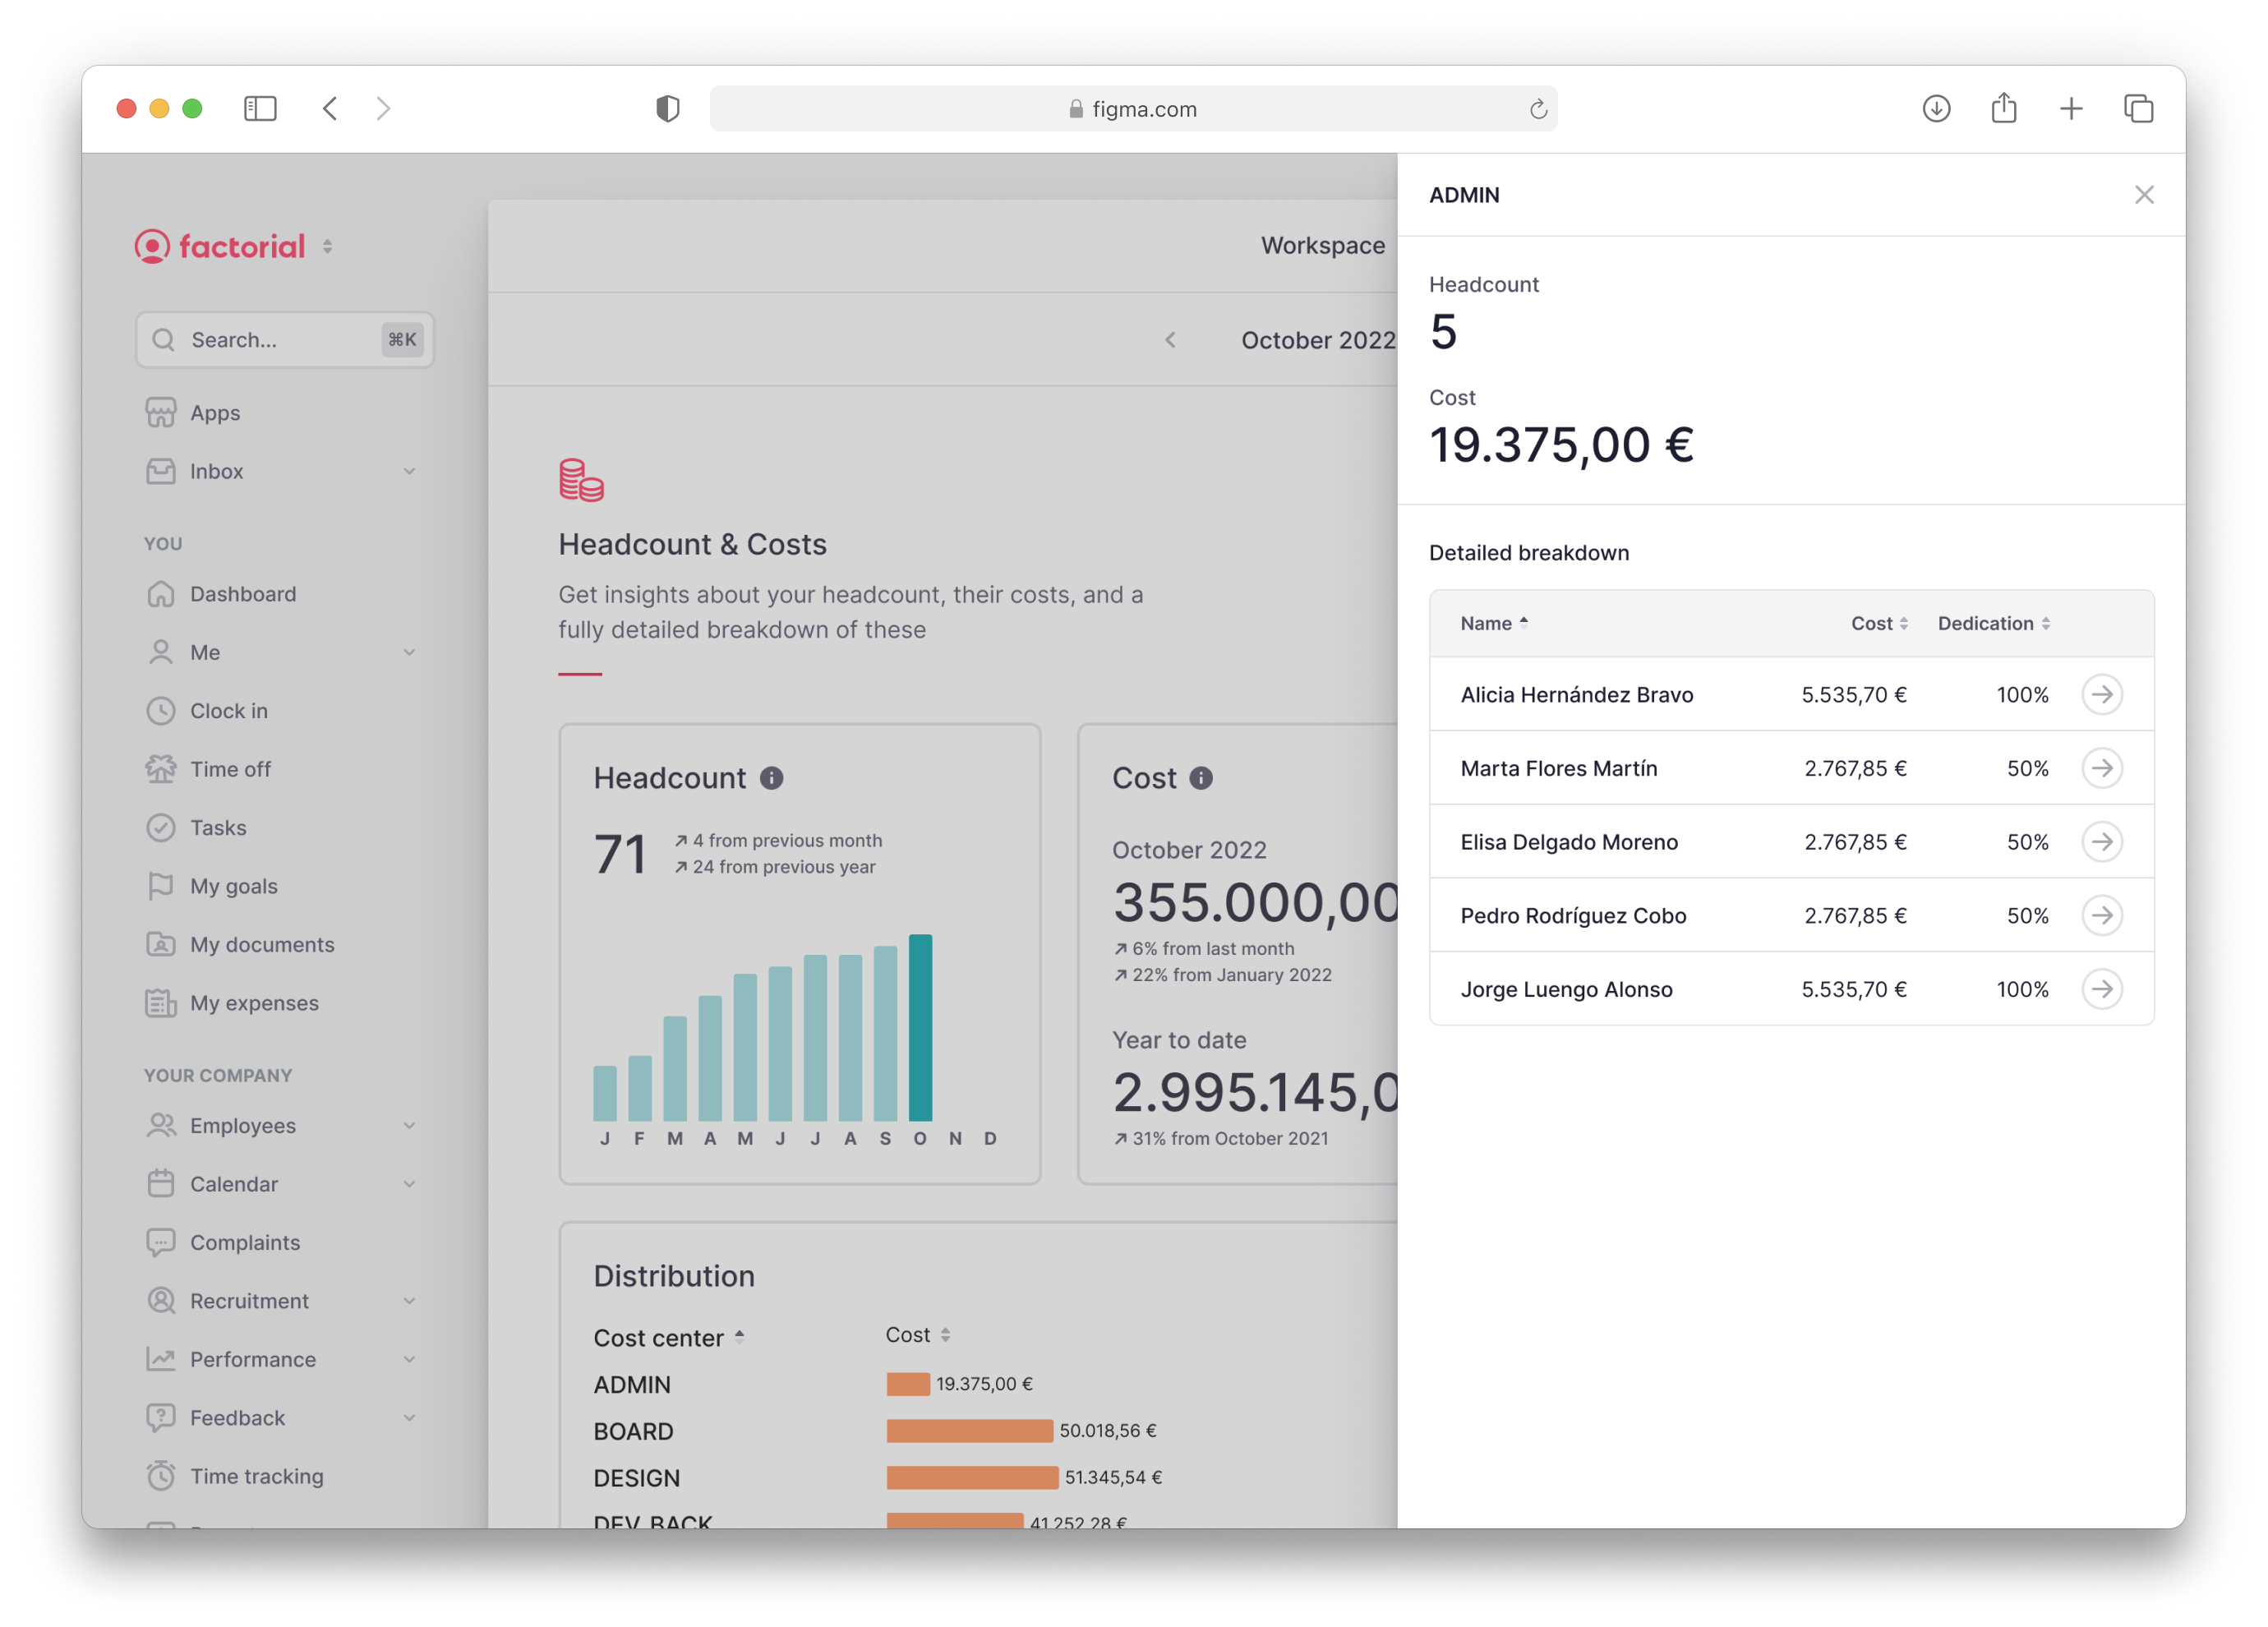
There were two data sources: payroll summaries and gross salaries. Both were already managed in other areas of the platform.
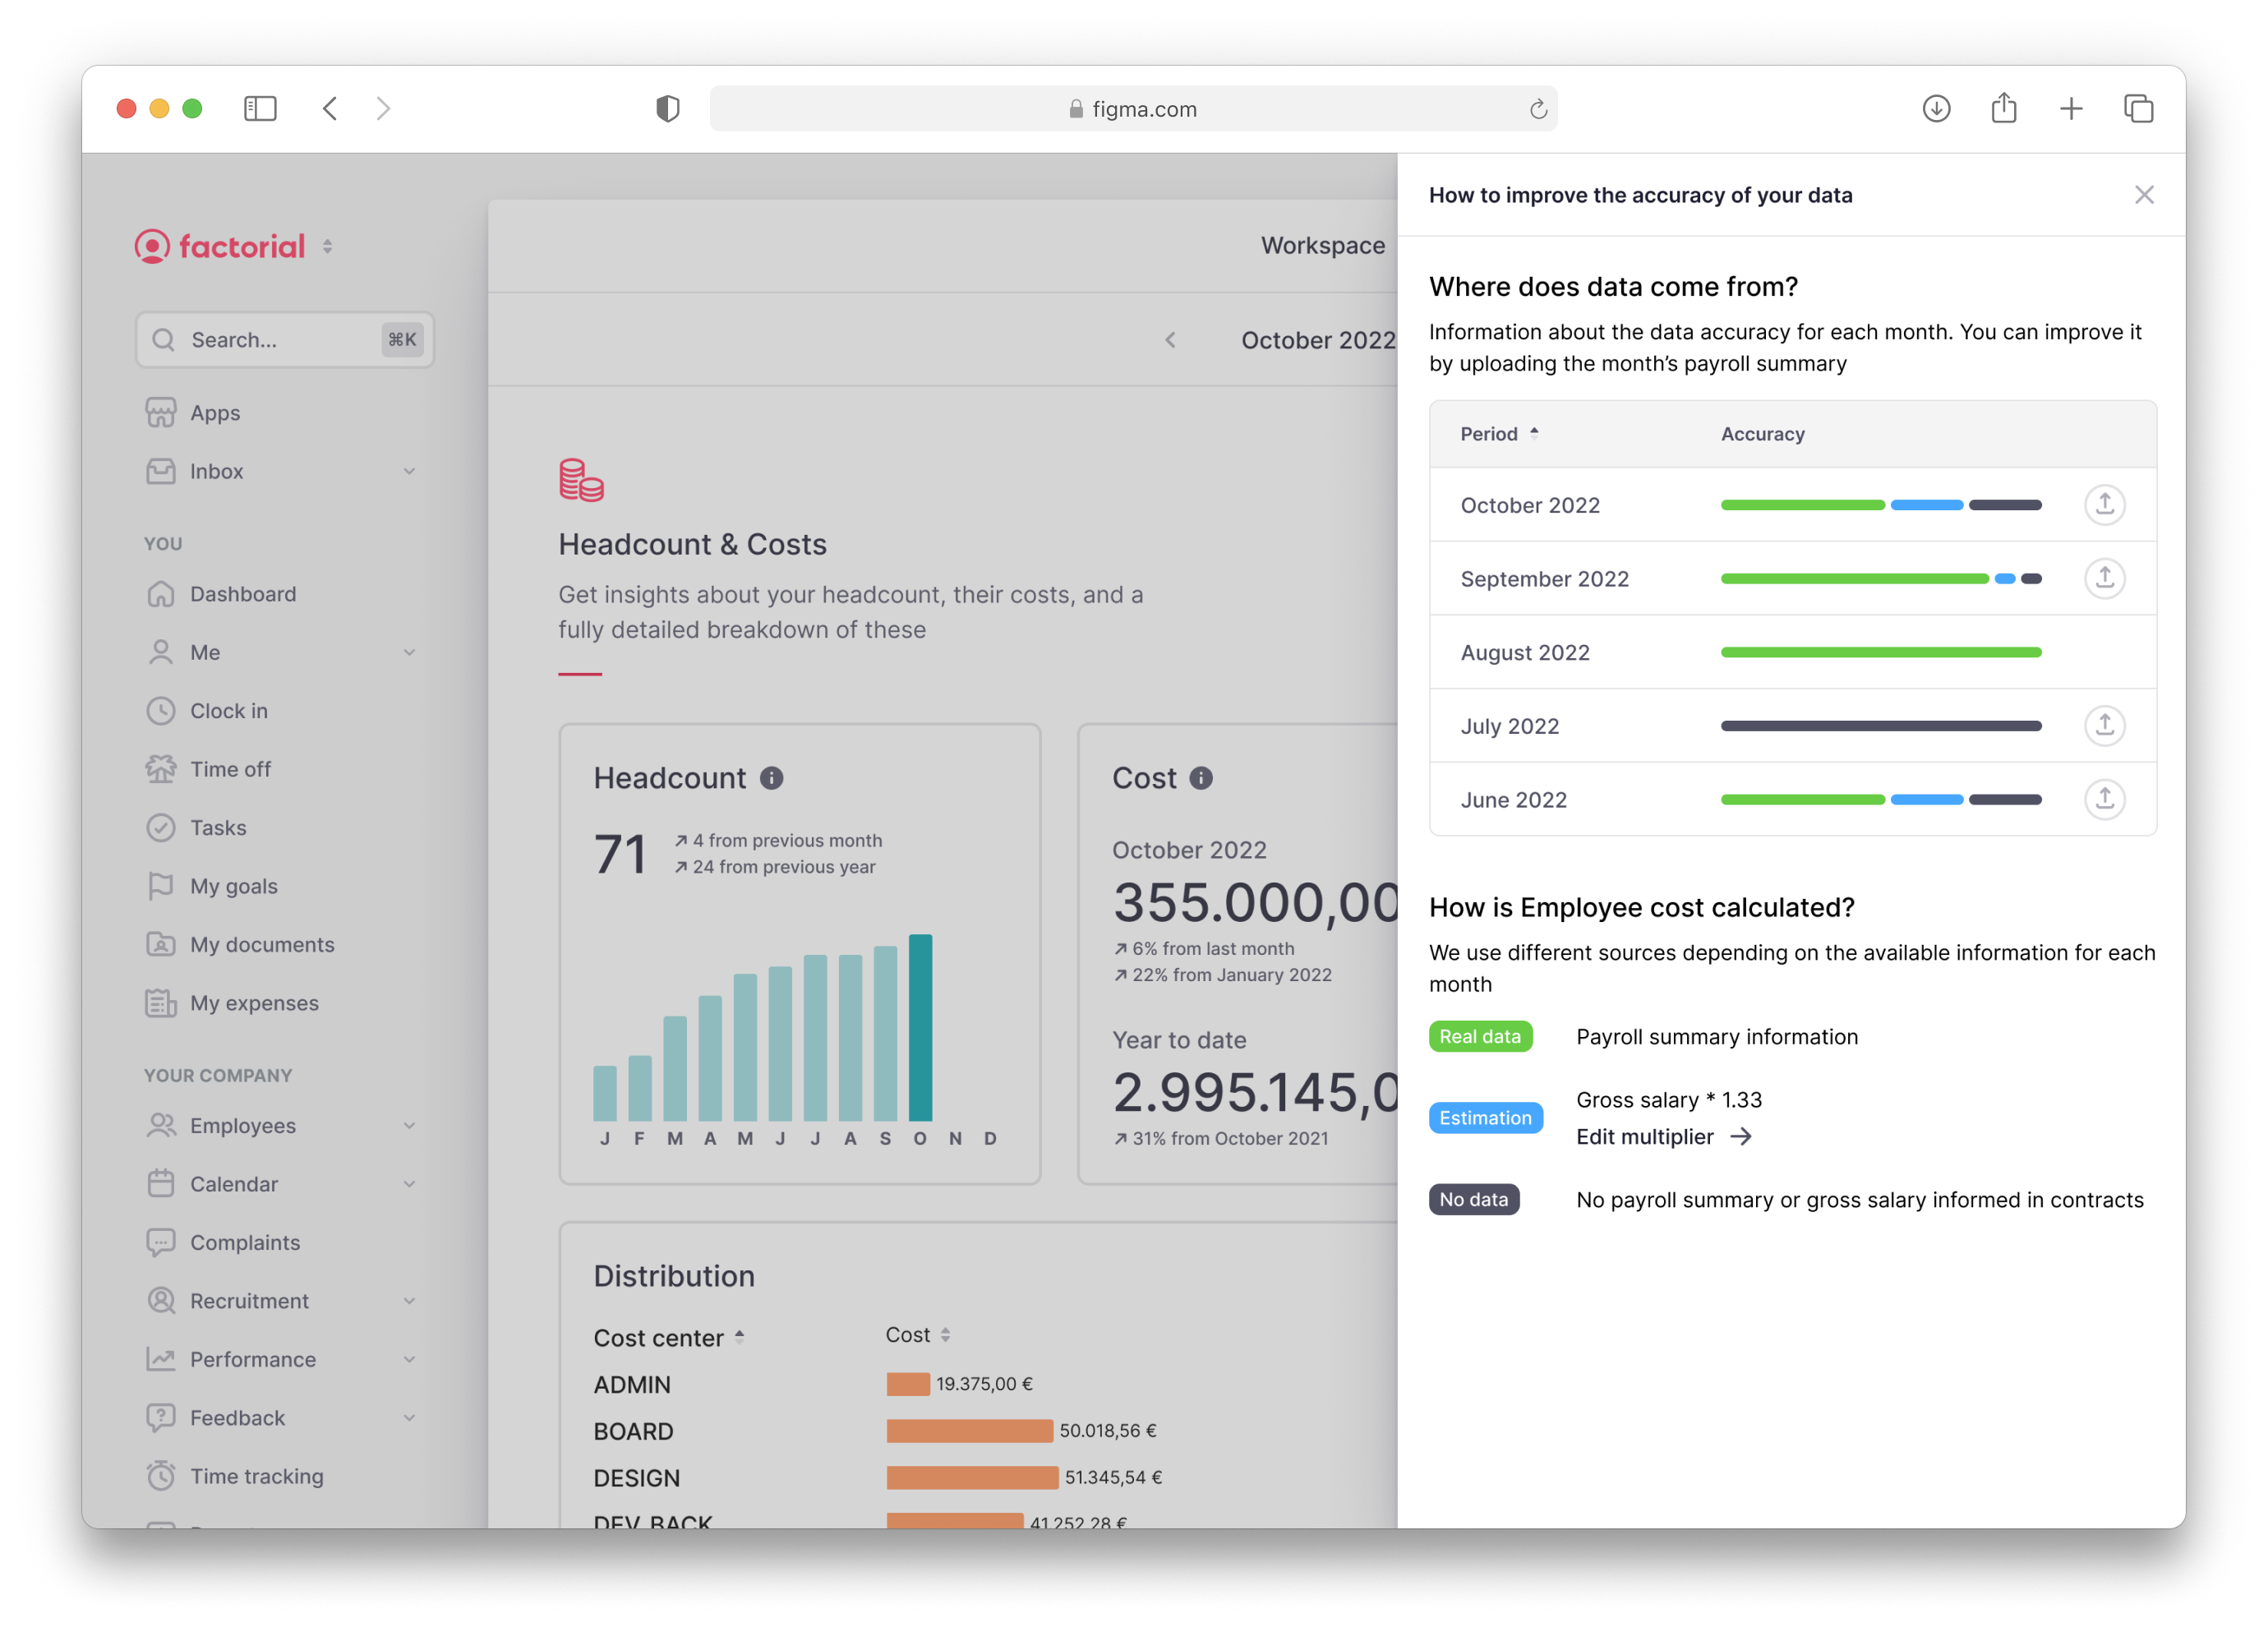
- If the company had uploaded the payroll summary for the month we had real data.
- Otherwise we estimated the cost from the gross salary depending on the country (in Spain you can estimate the cost by multiplying the gross salary per 1.33).
- If the company didn’t fill out the information about salaries we didn’t have any data to show, so we worked in empty cases to explain users how to upload the data so they could get insights in the Workspace.
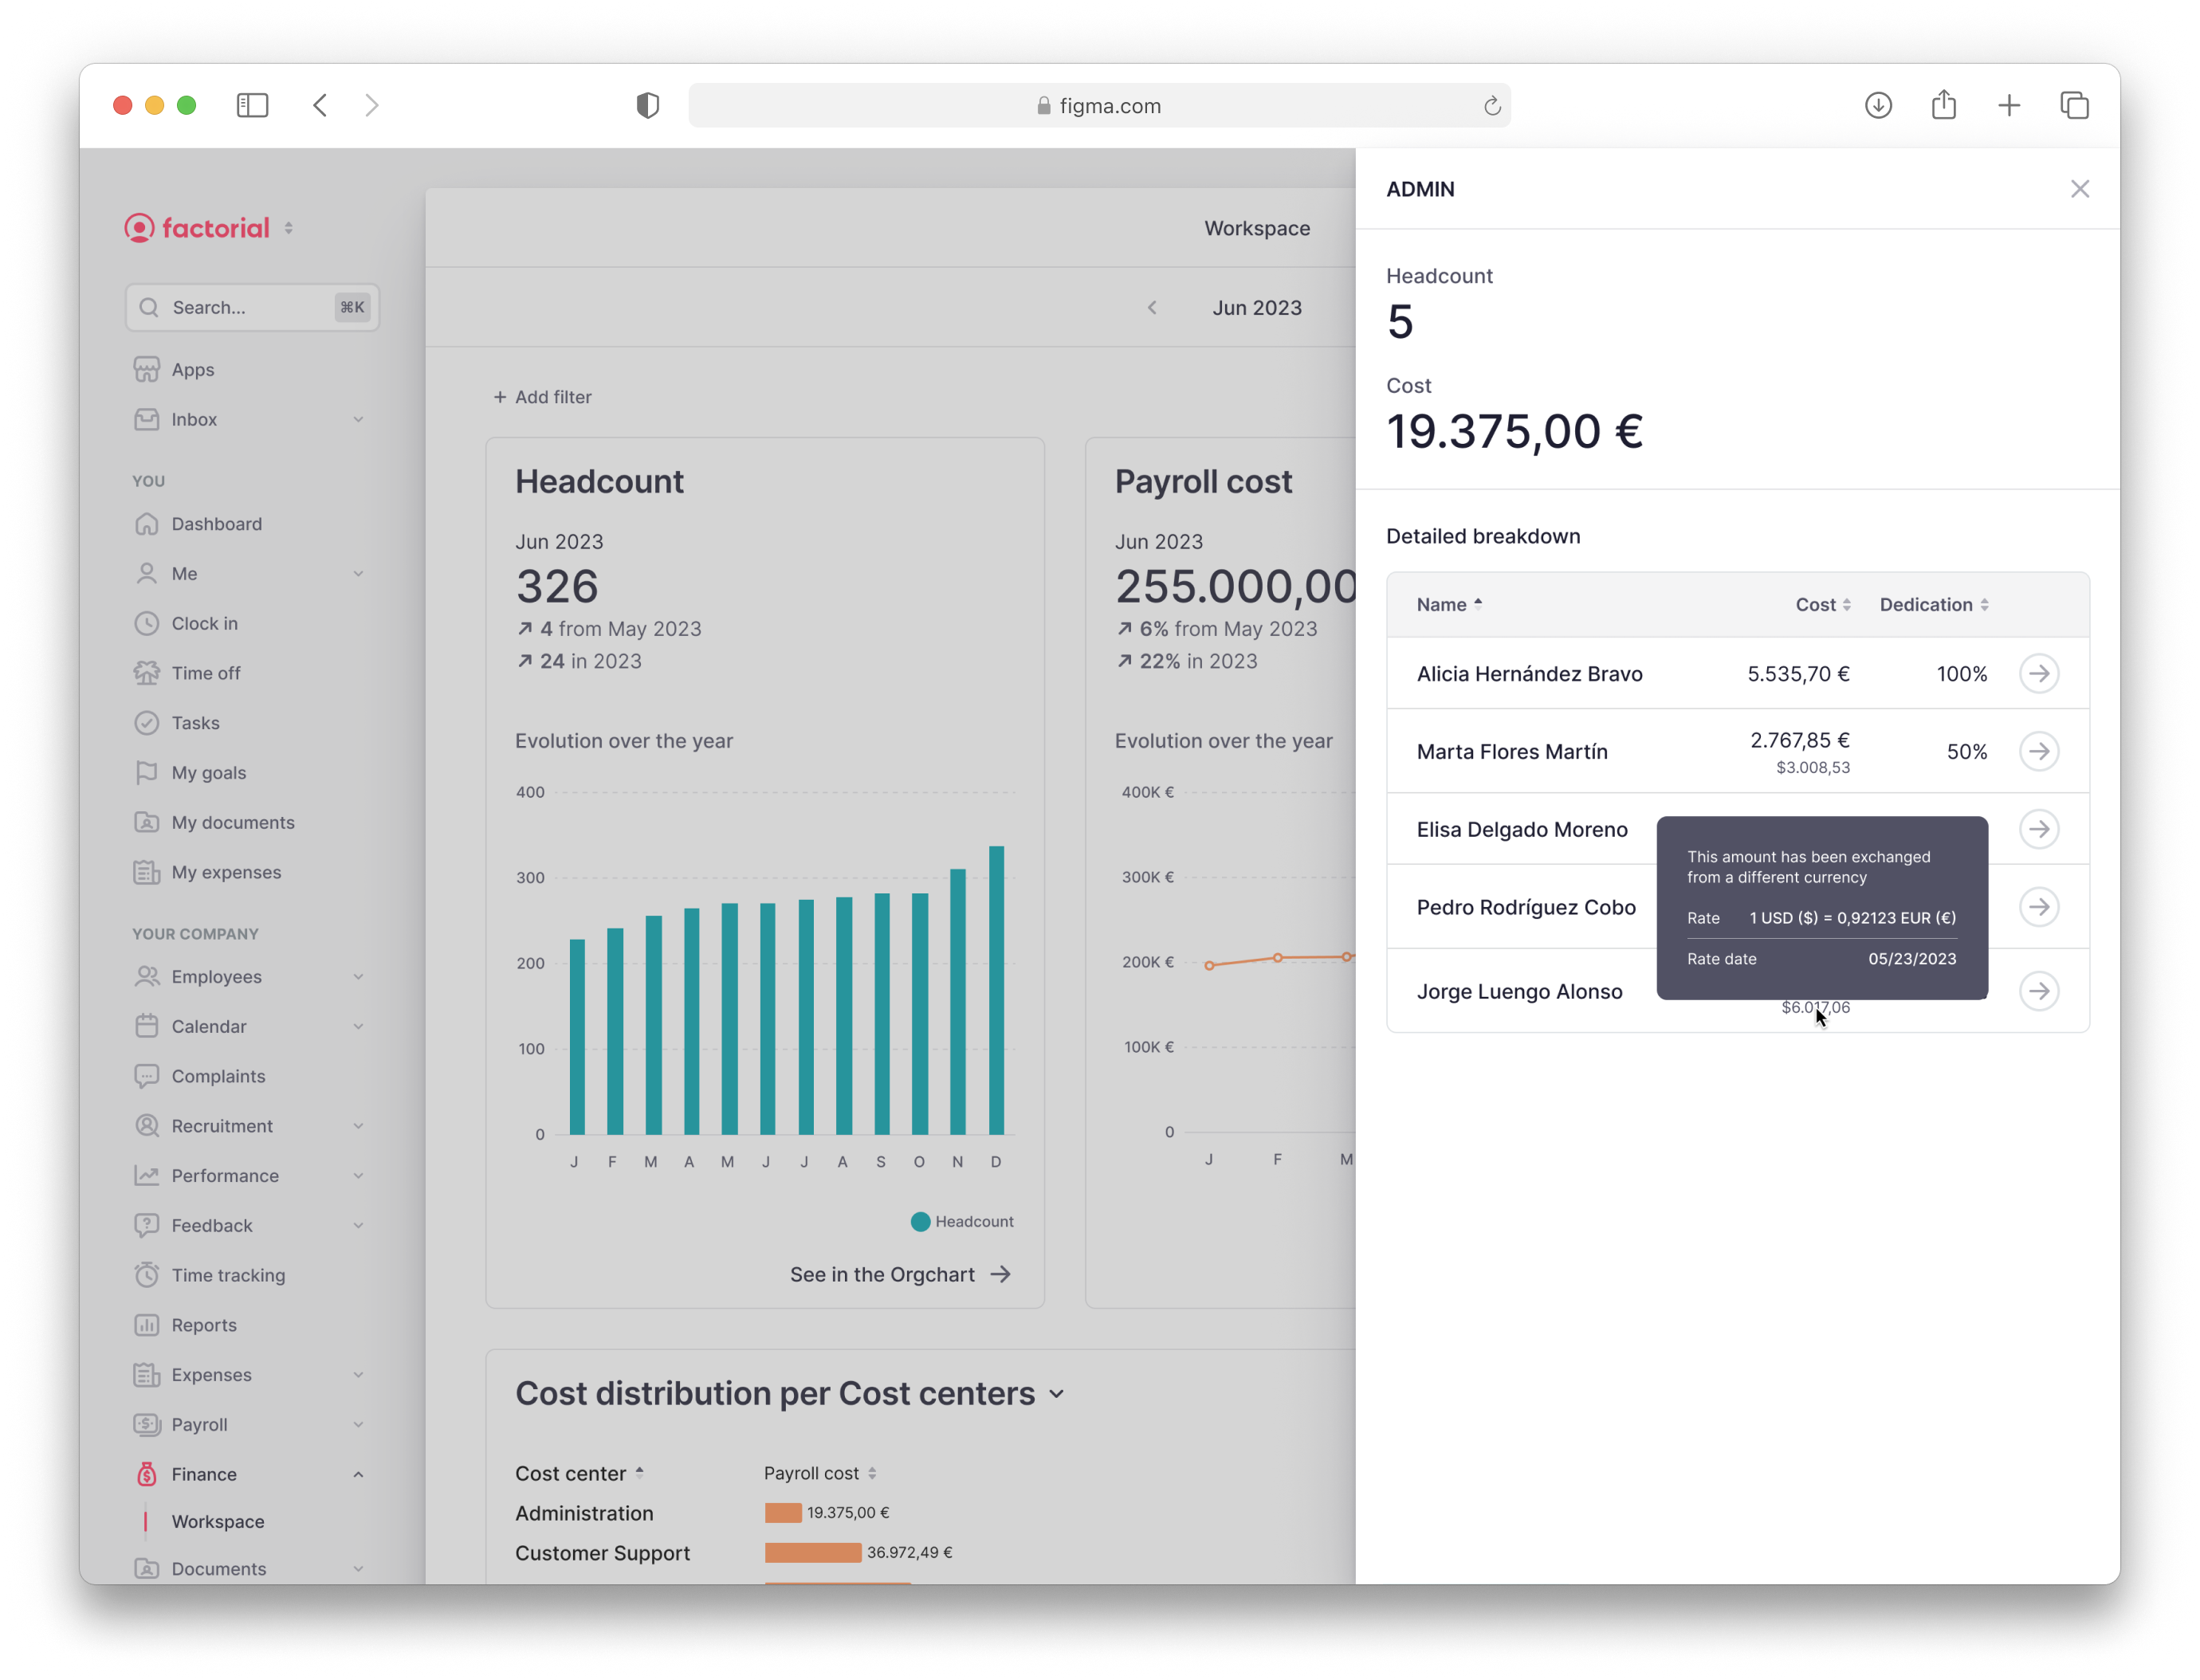
In the research we learnt that users needed to trust the data they were seeing and understand if the numbers were 100% real or an estimation. They also needed a way to adjust it in the cases where it wasn’t real. We added information about the accuracy and datasources on top of the space. This way we managed expectations of what was going to be seen.
Along with the Product Trio, I took our prototype and made some demos with sales and customer experience for the companies to know our product, and even before launching near 15 companies had shown interest. The team got green light to keep working on after the first version.
This allowed me to work on a new version of the charts, adding axis and legends among other things. There were other teams interested in evolve them so I put together a team of designers to work on it and apply the changes to the whole product.
I also collaborated to improve the filters for the entire platform. It was a bigger project than charts because they were a key component with more cases to have in mind.

At the end of the second Q working on the Finance Workspace we had achieved 115 companies using it on a monthly basis to check their employees’ costs.
Key iterations
We iterated many things in the following Qs after launching. Every week we had meetings not only with clients, to hear about their feedback and problems to solve, but also with customer experience and sales. On top of it, we had the vision about integrating more sources and dimensions into the Workspace to make it more complete and give more insights. There are three iteration projects that I want to highlight because of their complexity and value for companies.
Multi-currency and exchange rates
38% of the companies in Factorial used more than one currency. This 38% represented 71.2% of Factorial’s MRR and they were unable to use the Workspace because it only worked when all legal entities had the same currency. For the first launching it was «solved» it by adding a filter for these companies to see each legal entity data in its currency, but we didn’t offer a consolidated view with the global numbers in the same currency. That view was the most valuable for companies so without it most of them weren’t willing to pay for our product.
Payroll items
After we launched the first version, many companies told us that company cost was the most valuable item to have in the workspace but they needed more detail about payroll concepts to fully analyze the company costs. That is, to break the company cost into some important items like IRPF, taxes, benefits, etc. These concepts are detailed in the payroll summary file that they provided for us, so we had them.
We iterated the payroll costs cards, allowing users to select up to 5 items to see at the same time, to maintain chart legibility. The user selects the concepts in a second level list that shows all of them and opens when click on the pencil icon.

Expenses costs
Other than payroll we always had another cost datasource in Factorial: the Expenses management module. The Workspace belongs to a bundle of modules related to Finance, so most of the companies that were paying for the Workspace also had the Expenses management module. This module didn’t offer much information about insights related to expenses and companies were asking us to see this data aggregated in the Workspace.
It also was totally aligned with our vision of adding datasources for the companies to have the whole company costs in the same place.
We added a card before the existing ones that aggregated all costs (prepared to scale when more data is added) and added a new column in the distribution card.

Key learnings
There are so many learnings that are difficult to sum up in a paragraph.
At Factorial I learned to really work with a Product Trio, relying on my colleagues and trusting them, but also discussing a lot and committing to share ownership of choices. Thanks Joe and Guillem for every day we worked together, I loved it and I learnt a great deal from you two ❤️
I also have improved in prioritization and breaking the problem as much as possible to launch small solutions to provide the maximum value and iterate the product. It makes no sense to work in a big product for a long time and then launch, but to validate as soon as possible and improve with small pieces and adding users’ feedback.
And finally, I learnt a lot about other areas such as Sales, Customer Experience, Product Marketing, and of course Finance thanks to collaborate with other teams and understand how Product doesn’t make any sense in a company if we don’t work close with the all of them.
Thanks for reading!
I hope you enjoyed, feel free to reach me if you want more information, give some feedback or have a coffee and talk about product design 😊
Here you have some more projects I’ve participated over the past few years